Tactile
New Game Analysis
Overview
We'll be looking at a range of statistics that will help us understand how the game performed over the first month after release. This will include:
- Business Indicators - Installs, engagement, retention, in-app purchases
- Game Structure - Version changes, level difficulties, user drop-off, which levels led to conversions, and the game economy
- Marketing - Performance of the different marketing campaigns
Business Indicators
Installs over time
As measured by newPlayer events, there was a total of 102,392 installs over the 31 days.
Installs by Country
The following chart shows the top 20 countries in terms of installations.
Engagement - Daily Active Users
Number of users that recorded any event on a given day.
Engagement - DAU/MAU
The ratio of Daily Active Users to Monthly Active Users (MAU) shows how well an app retains users. DAU/MAU for February 2006 was:
Average DAU: 18,879
February MAU: 96,339
DAU/MAU ratio: 19.6%
Most successful games have DAU/MAU ratios of around 20%.
Engagement - Daily Rounds
Number of times the average user is opening the app on a daily basis.
Retention - Day N Retention
Number of users that installed the game on Day 0 and then recorded an event on Day X.
Retention - Day N Retention - All Devices
Number of users that installed the game on Day 0 and then recorded an event on Day X.
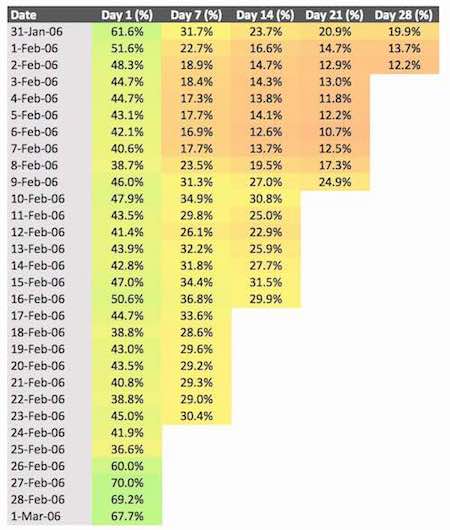
Retention - Day N Retention - WebGL
Number of WebGL users that installed the game on Day 0 and then recorded an event on Day X.
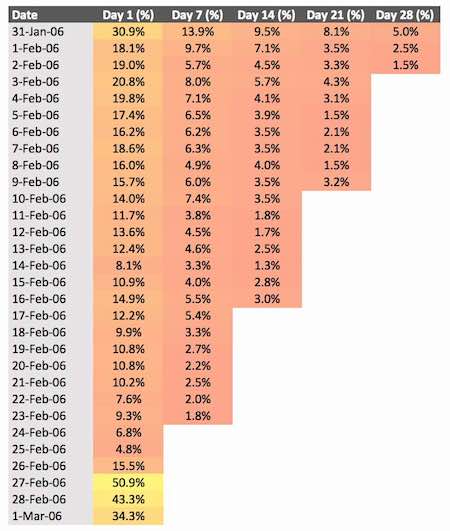
Retention - Day N Retention - All Except WebGL
Number of non-WebGL users that installed the game on Day 0 and then recorded an event on Day X.
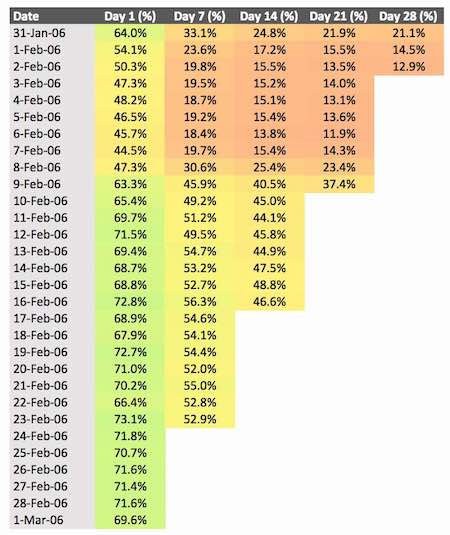
Retention - Played for more than a day
What percentage of users played the game for more than one day.
In-App Purchases over time
Total in-app purchases over time.
Revenue Per Daily Active User/Paying User
Revenue per Daily Active User (ARPDAU), and per Paying User (ARPPU).
Spending Types
For users who have made a purchase, how many purchases are they making?
Spending Types
How much revenue is being created by each category of users?
Top Countries
Countries generating the most revenue.
Top and Bottom Countries - Normalized
Highest and lowest countries for revenue per install.
Game Structure
Versions
Has the difficulty changed from version to version?
Versions - Timing
When were users using each version?
Versions - Level Attempts
Which levels were users attempting in each version?
Level Difficulties
Which levels are the most difficult (most failed attempts)?
Player Drop-Off
Which levels cause the most players to give-up (next level never attempted)?
Player Drop-Off by Level
What does user drop-off look like over the first 100 levels?
Encouraging Conversions
Which levels are leading to users' first purchases?
Coin economy over time
What is the net balance of coins (coins received - coins used) each day?
Marketing
Campaign Summary
| User Type | Users | Revenue | Revenue per User |
|---|---|---|---|
| Campaign | 25,024 | 8,775 | 0.35 |
| No Campaign | 74,935 | 6,662 | 0.09 |
| Total | 99,959 | 15,437 | 0.15 |
Testing Campaign Significance
From the summary data, we might conclude that users coming from campaigns are more likely to make purchases, however, there could be confounding factors. For example, campaigns could be:
- Targetting richer countries, and those users are more likely to make purchases
- Targetting hardcore gamers who progress further and are therefore more likely to make purchases
- Targetting users with specific devices that are more likely to make purchases
- Providing users with coin bonuses, which then encourages users to make purchases
We can build a model to test this.
Testing Campaign Significance - The Setup
The model built attempts to account for all these factors, and has the following inputs:
- Country - Mean revenue per user from each country
- Device - 4 dummy variables
- User skill - Maximum level reached, percentage of failed missions, percentage of abandoned missions, and total mission events
- Coins - Total coins received and coins used
- Campaign - A simple flag if the user came from a campaign (1) or not (0)
We use these data points to create a Logistic Regression Model to that predicts whether a user will make a purchase (1) or not (0).
Testing Campaign Significance - Results
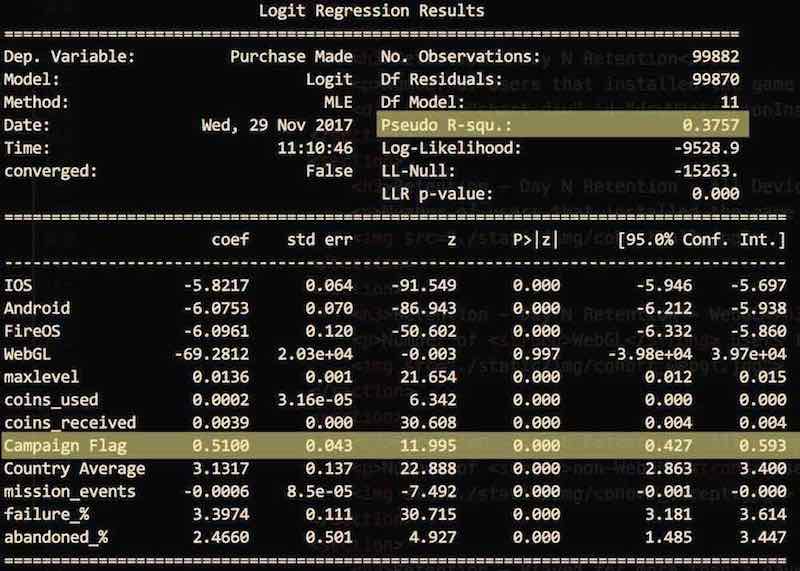
What does this mean?
What conclusions can we draw from this model?
- Campaign users are more likely to make purchases - Even when we take into account differences in country distribution, device type, level progression and coins, however there could be...
- Confounding factors - These results do not rule out the existence of other confounding factors that explain the remaining difference, which is why...
- More research is needed - Identifying all the factors that make campaign users more likely to make purchases can help to target future campaigns.
Model Performance
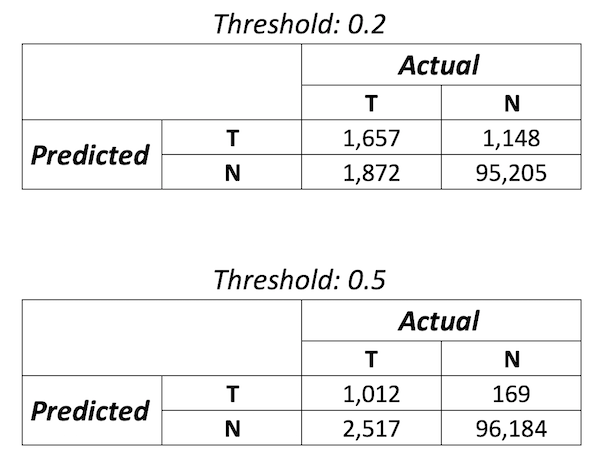
Model Performance
How accurate was the model?
Campaign Timing
When did the campaigns have the biggest impact?
Most Profitable Campaigns
Campaigns that produced the most revenue.
Case Study 1
Campaign ID: 9s5vVew1HvRvFU+l8FHarl/rh1WBtudlUUe+K5CuudM=
New users: 1,784
Revenue created: 1,065
Device used: Primarily IOS (1,772 of 1,784)
Country of origin: Users come from most developed countries
Appears to be a successful campaign. Attracted a large number of users, with 218 (or 12.2%) of those those users going on to make in-app purchases.
Case Study 2
Campaign ID: 4EPzfhaYBdO1groLb/JBb6j0OAV2bqxyn8fUBBeZ6HM=
New users: 215
Revenue created: 577
Device used: IOS
Country of origin: United Kingdom (212 or 215)
Appears to be a very positive campaign, but in fact, only 5 of the 215 users were paying users. It just happens that one of those users generated 573 of the 577 revenue.
Wrapping Up
Key Takeaways
- New installations are slowly declining, but Daily Active Users are increasing (particularly for Android)
- Rentention is strong and looks to be holding, but should be monitored
- Revenue from in-app purchases and ARPDAU are increasing
- Harder levels (e.g. Levels 30 and 56) are causing users to leave, but are also driving in-app purchases
- Marketing campaigns have had mixed results, but on a whole have been successful in driving revenue